Media gallery
Category: Cycling and transport
The City of Norwood Payneham & St Peters is committed to improving road safety, encouraging sustainable transport and enhancing community well-being.
The Council recognises that traffic speed directly affects the livability and safety of our streets and neighbourhoods. Lower speed limits can help improve safety and livability for all road users, without significantly impacting travel times or conditions for motorists.
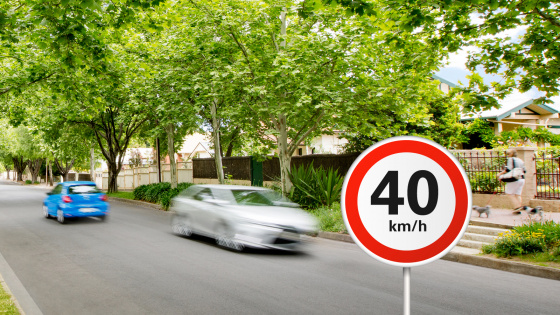
The benefits of reducing the speed limit from 50 km/h to 40 km/h are to:
- Provide a safer road environment for pedestrians and people riding bikes on local roads.
- Reduce the likelihood and severity of crashes.
What to expect:
- New speed limit signs will be installed to reflect the updated speed limit
- Temporary ‘Speed Limit Changed’ signs will be displayed for two months in affected areas
- South Australia Police (SAPOL) will be notified of the changes
- Information will be provided to affected properties, posted on social media and available on the Council’s website.
Broader context
The South Australian Government’s Road Safety Strategy sets a long-term vision of achieving zero lives lost on our roads by 2050. The strategy is guided by the Safe System approach, which recognises that people will make mistakes and that the road transport system should be designed to minimise the likelihood and severity of crashes.
A key principle of this approach is managing vehicle speeds to suit the surrounding road environment and land use. Lower speeds are proven to significantly reduce the risk of death and serious injury if a crash occurs.
The strategy also encourages local councils to apply the Movement and Place framework when considering road safety initiatives and speed management. This framework recognises that roads serve a dual purpose: enabling movement within the transport network while also providing places where people live, work and interact.
Residential streets typically have a lower movement function and a lower place function, making them well suited to lower speed environments. These environments can help improve safety, accessibility and overall neighbourhood amenity for all road users.
Death and Injury Percentages Graphic:

Source: Austroads. Survivability rates vary significantly based on a number of factors and scenarios. Data taken from Research Report AP-R560-18 published in March 2018 by Austroads - the Association of Australian and New Zealand Road Transport and Traffic Authorities.
40km/h Citywide progress Map
This map shows the suburbs with existing 40 km/h speed limits, those with approved limits, and areas under consideration for future 40 km/h speed limit changes.
Blue - Existing 40km/h
Purple - New 40km/h
Yellow - Future 40km/h